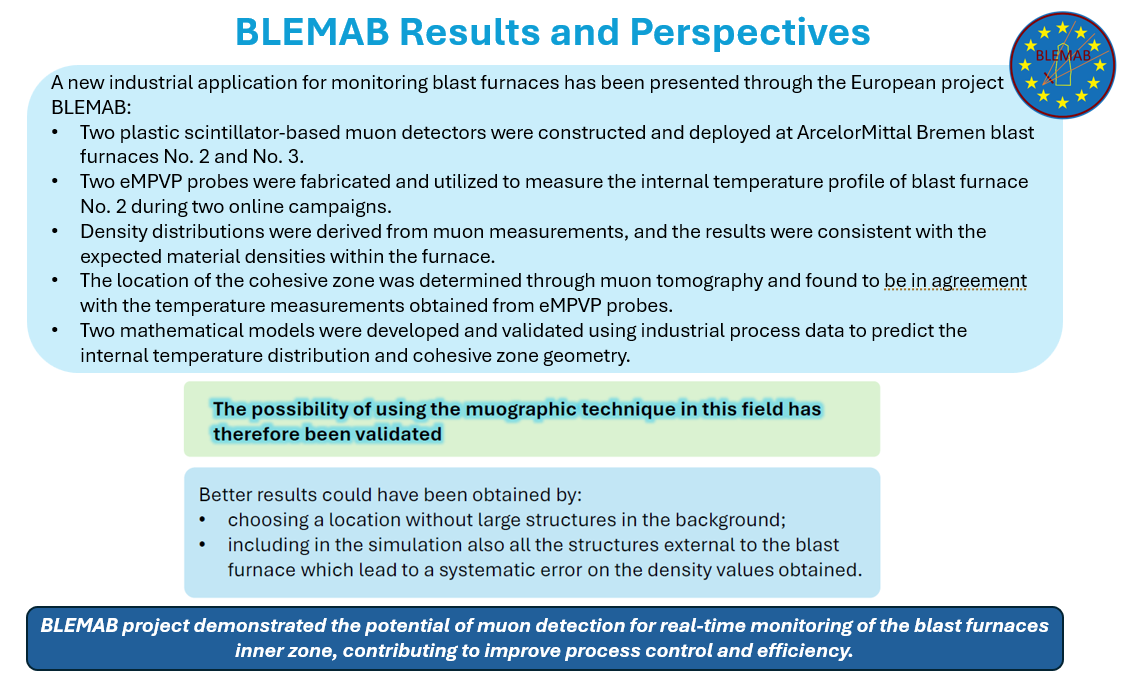
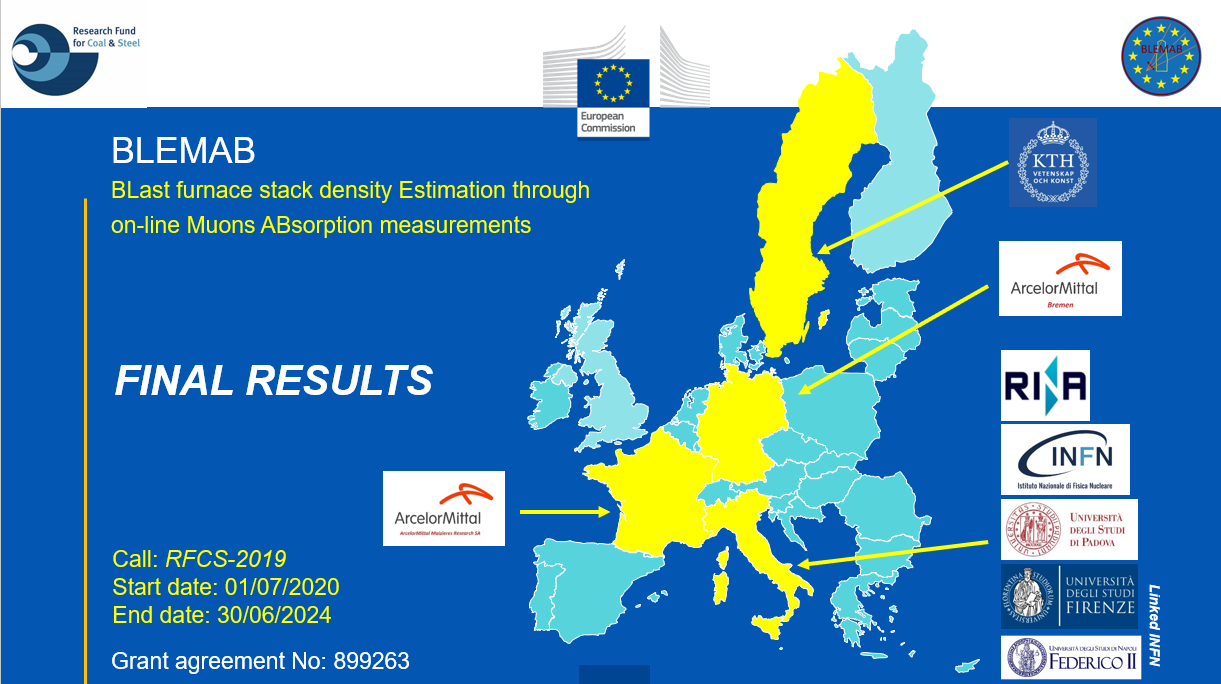
BLEMAB Project final results
The BLEMAB project was completed on June 30, 2024, following four years of activity. The subsequent slides present the primary outcomes.
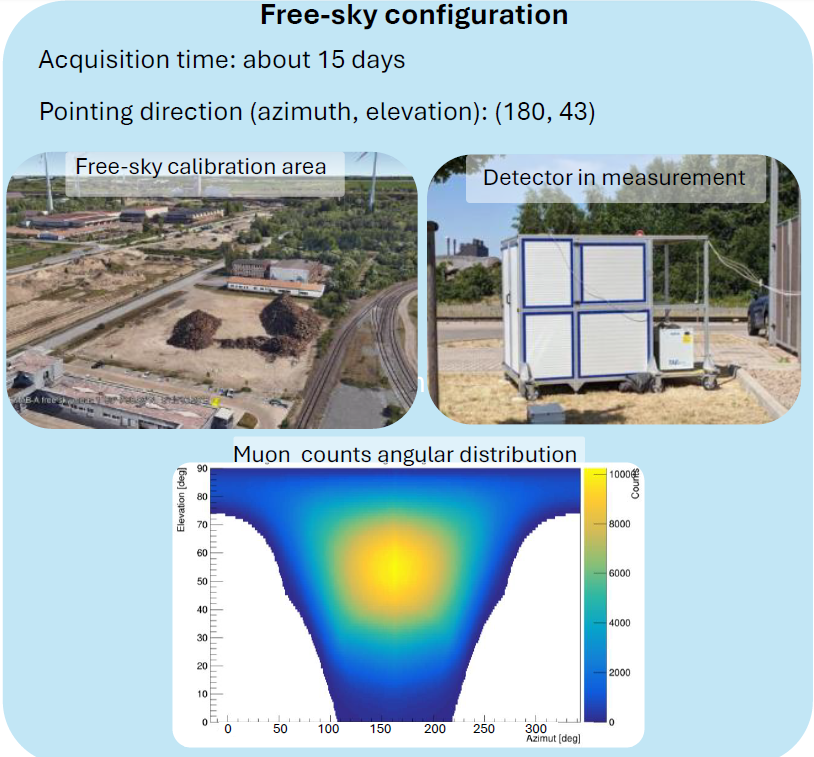
Prior to installation at the BF2 blast furnace in Bremen, the first muon detector was installed in an open space inside the plant for a
preliminary free-sky calibration measurement. This measurement served two purposes: establishing a baseline for the muon flux intensity
at Bremen's latitude without the presence of obstacles and verifying the functionality of the entire measurement system after transport.
The level of muon background radiation is mainly determined by the latitude of a location and remains remarkably consistent throughout
the year. This consistency allows it to be considered a stable and reliable source for scientific measurements, despite being influenced
by random processes and atmospheric conditions.
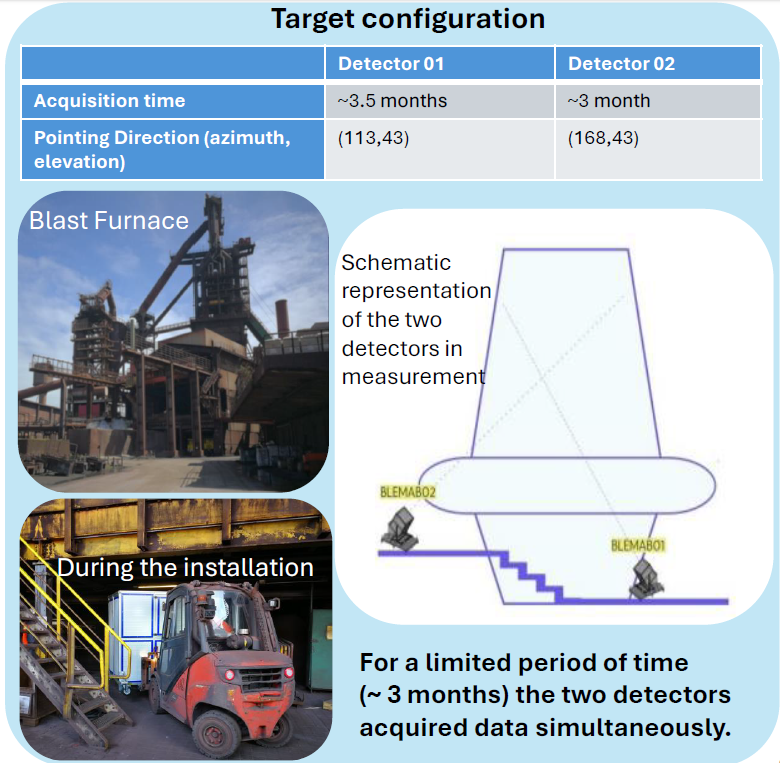
After free-sky calibration, INFN and ABG have identified suitable positions for the muon prototype apparatus near the blast furnace Nr.2.
ABG proposed three possible positions, one at cast house and two at the tuyere level:
It was determined to place muon apparatus No. 1 (BLEMAB 01) in position 1 and muon apparatus No. 2 (BLEMAB 02) in position 3.
On August 7-8, 2023, coinciding with their installation at BF2, the BLEMAB 01 and BLEMAB 02 muon detectors commenced data acquisition and continued
uninterrupted, concluding in early 2024.
The zenithal tilt of the pointing direction was maintained the same as for the free sky measurement. The azimuth angle of the pointing direction
was set to 113° for the BLEMAB 01 prototype and 168° for BLEMAB 02.
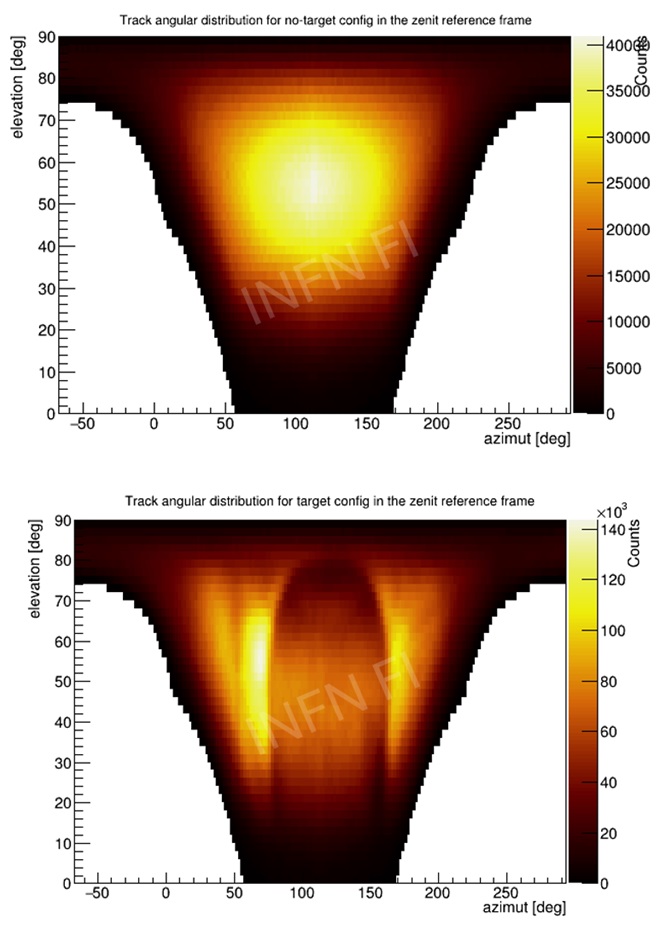
These two images have been made using the whole data sets, thus representing the number of muons collected over the whole period. The shadow
of the blast furnace and the structures around it are clearly visible.
By comparing the two maps above we can create a map showing the muons that penetrated (or conversely, were absorbed) by the target (in this case
the blast furnace). This map is called a transmission map.
Alternatively, if we compare the map of measured field muons with the known thicknesses or estimated average density of the blast furnace structure,
we can generate two additional maps: the opacity map and a density map.
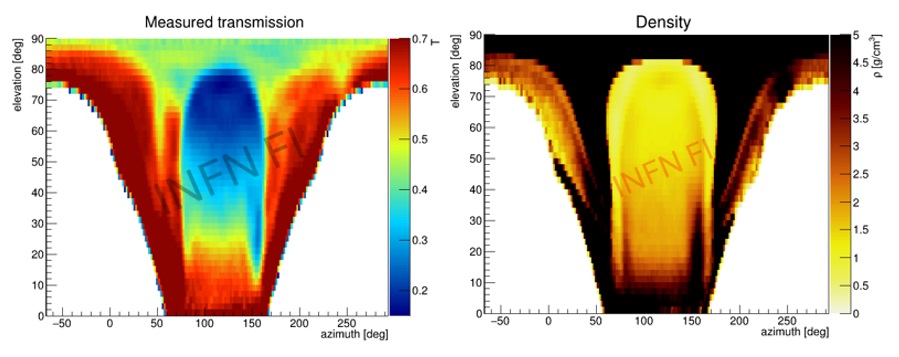
2D angular distribution of measured muon transmission (left) and average material density (right) reconstructed by the Florence INFN-UNIFI team.
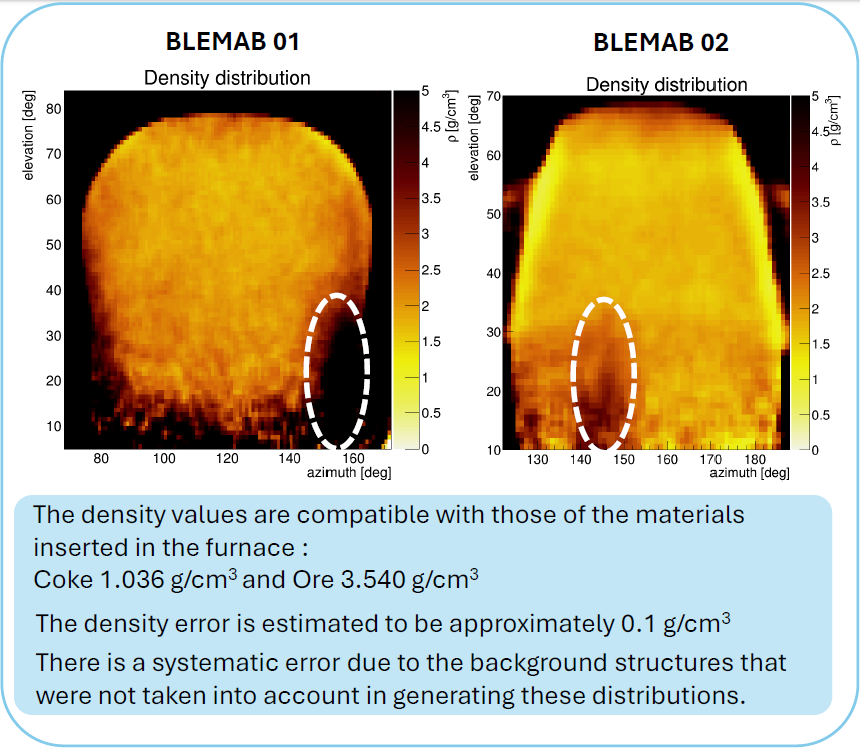
Detailed images of the detected density distribution from BLEMAB 01 and BLEMAB 02 detectors at Arcelor Mittal Brema blast furnace nr.2.
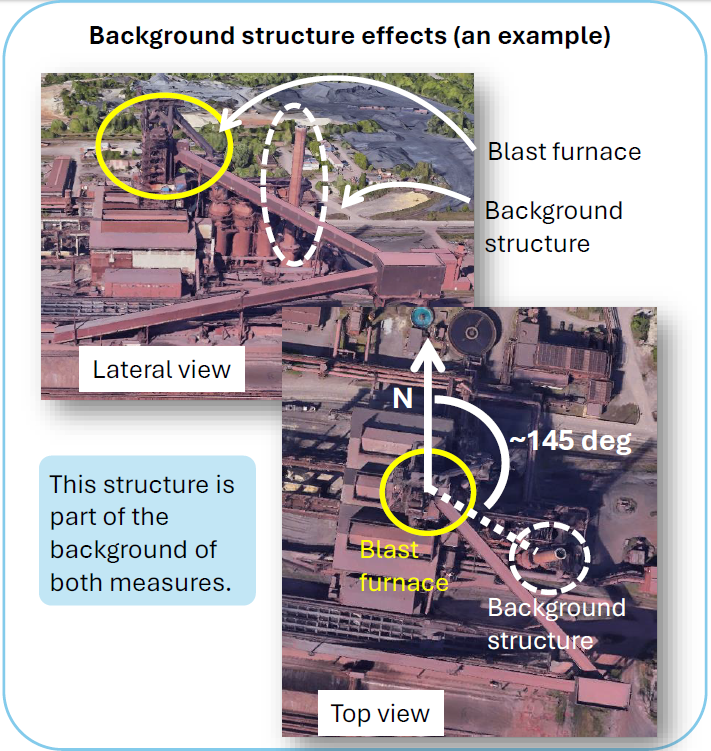
Influence of large-scale structures surrounding the blast furnace on muon measurements.
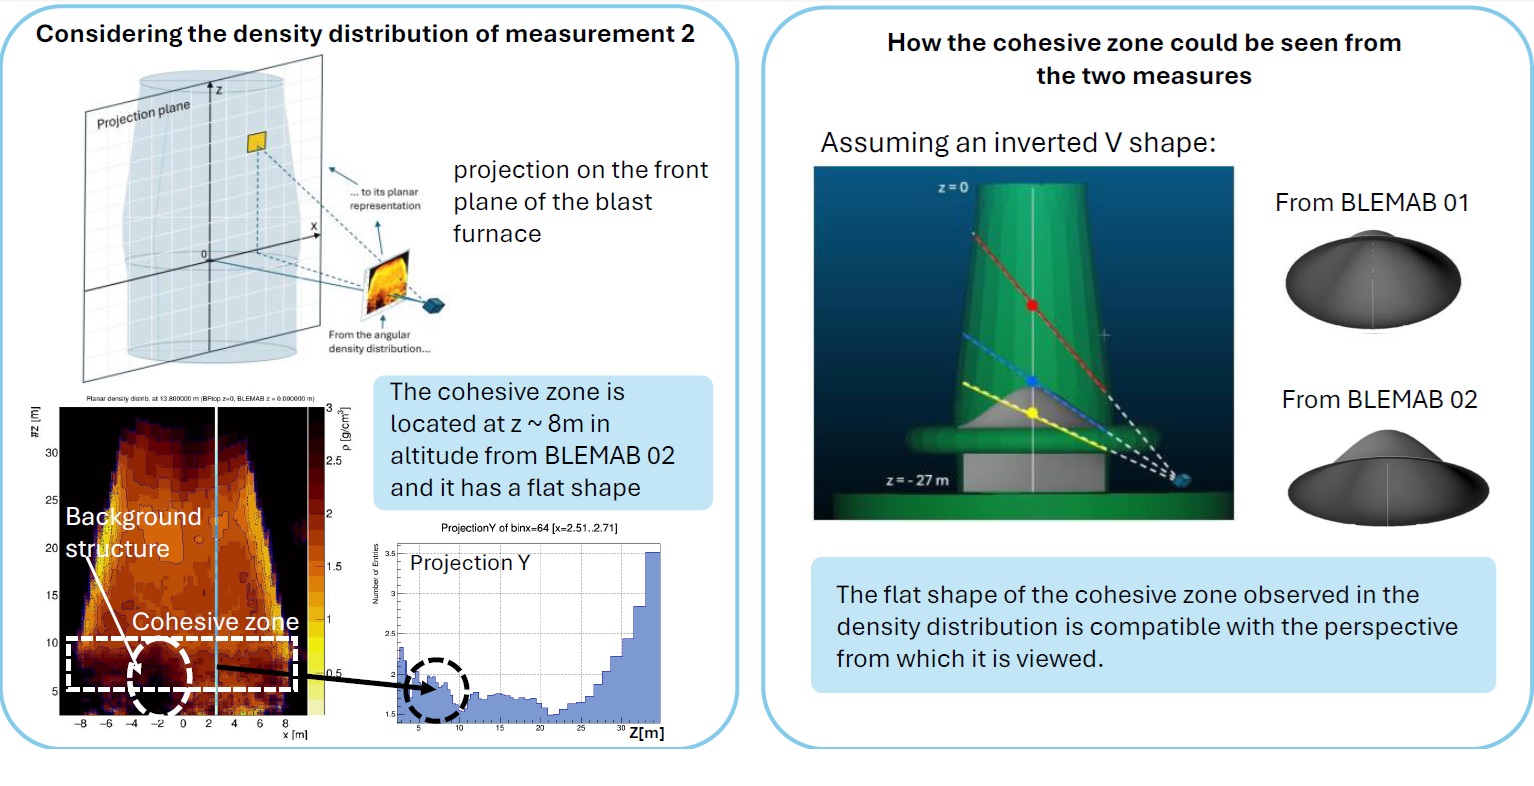
Detecting the shape of the cohesive zone using muon detectors has proven to be particularly challenging. The position of the detectors significantly influences the resulting images of the cohesive zone. Notably, the observation point adopted, with detectors positioned below the cohesive zone, has yielded a flat image rather than the expected bell-shaped profile. The figure on the right highlights the distortion of the cohesive zone, which is most pronounced for the lowest detector, BLEMAB 01.
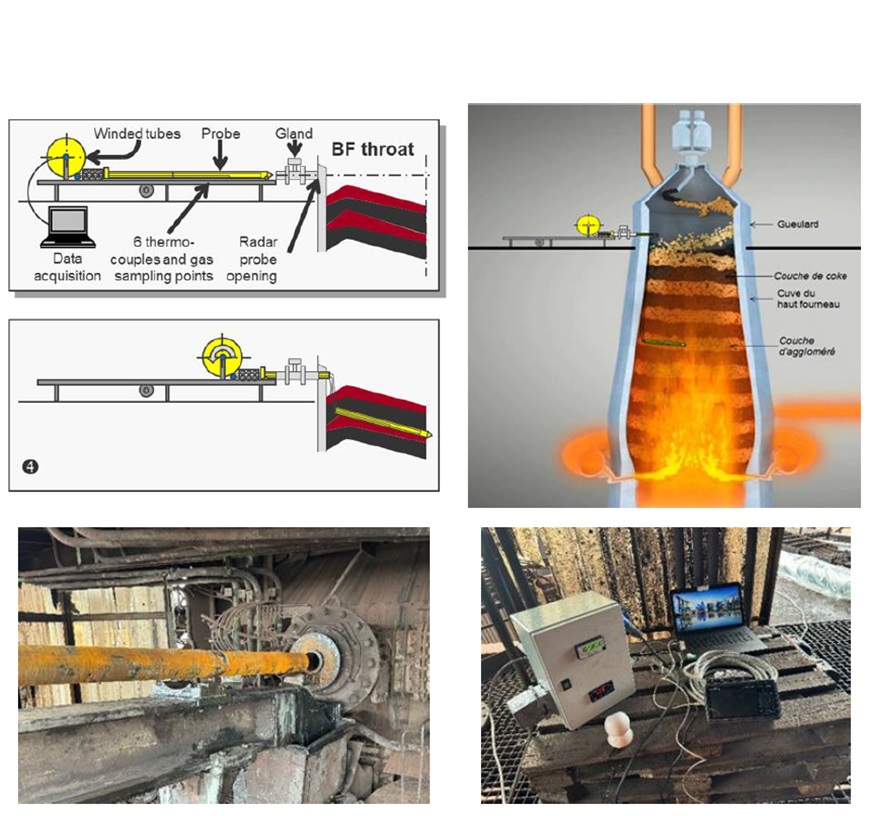
During the BLEMAB project, ArcelorMittal Maizières conducted two tests using eMPVP probes on Blast Furnace 2 at ArcelorMittal Bremen to measure the temperature profile from the throat to the cohesive zone. A schematic of the eMPVP measurement methods and its components are depicted in the figure.
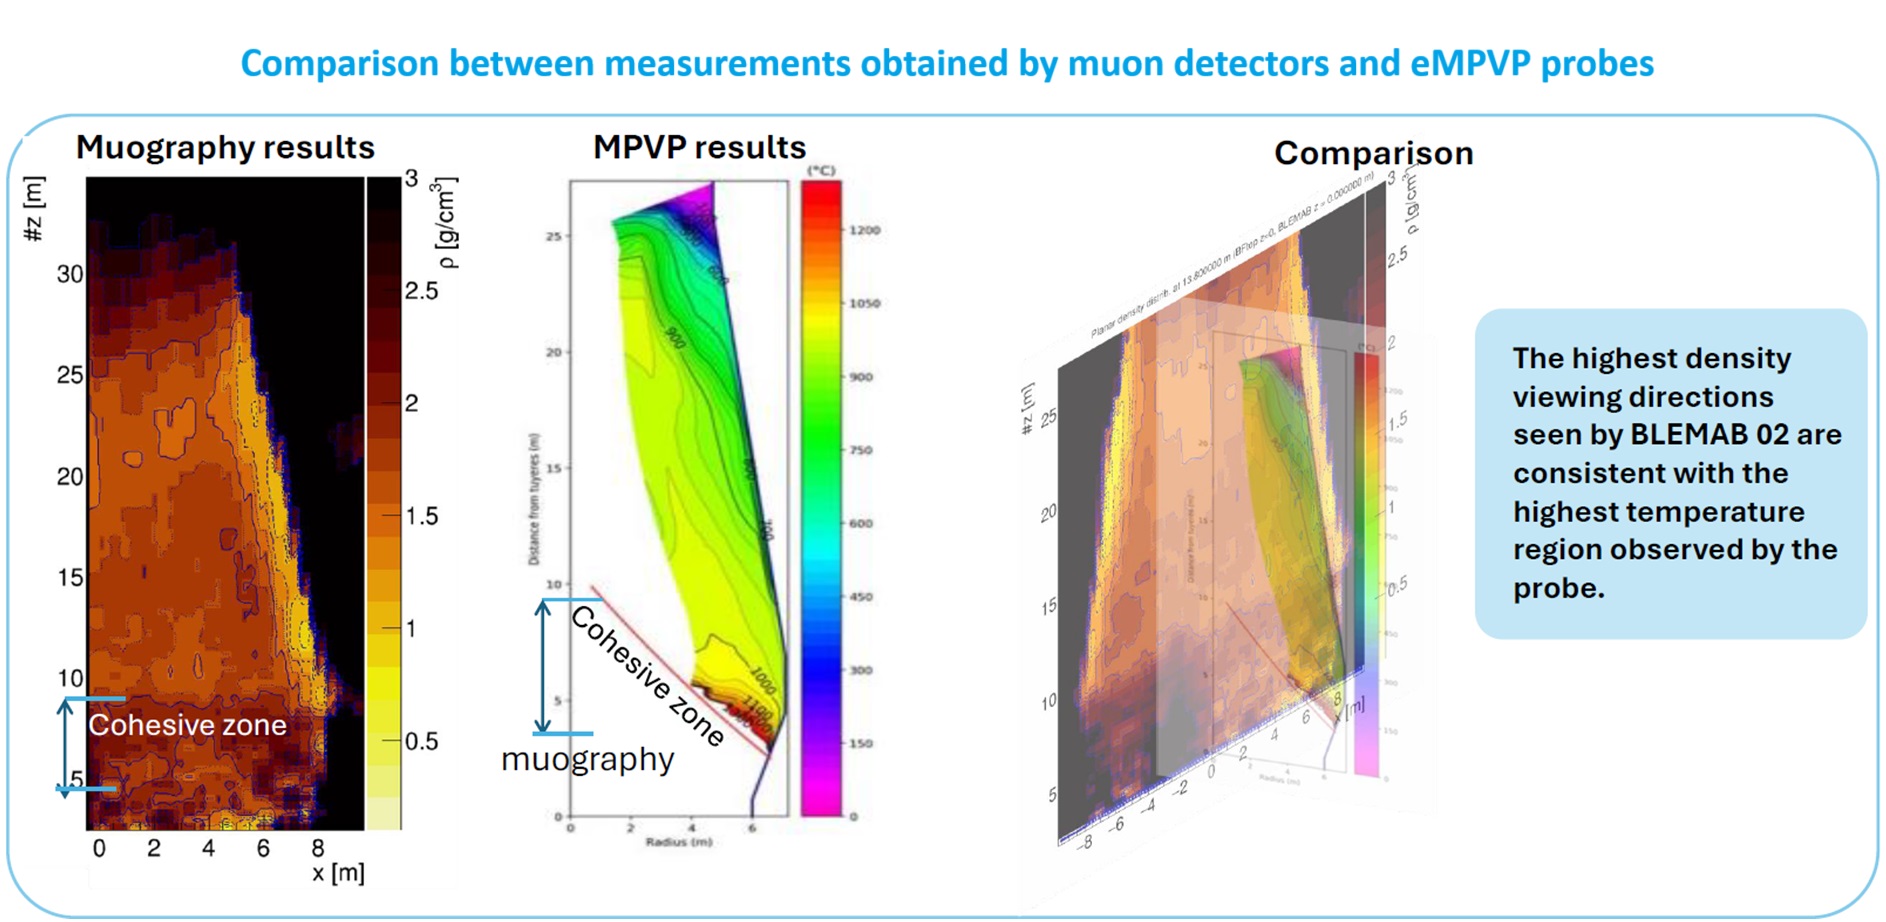
Comparison between measurements obtained by muon detectors and eMPVP probes.
Muon data were analysed independently for the periods corresponding to the deployment of the eMPVP probes at BF2 in such a way to try
comparing the results. The eMPVP were used in two runs, called RUN1 and RUN2. During both runs the two BLEMAB 01 and BLEMAB 02 muon detector
prototypes were both running and taking data at BF2.
For RUN1 and RUN2 approximately 12-14 hours data were analysed for each prototype detector.
The average density measured in RUN2 was slightly lower than that measured in RUN1.
The difference between the density values of the two distributions is on average less than 4%, which corresponds to a difference of 0.08 g/cm3
when considering the average value of the measured density, which is approximately 2 g/cm3. This systematic effect is of the order of the
uncertainty expected from the measurements.
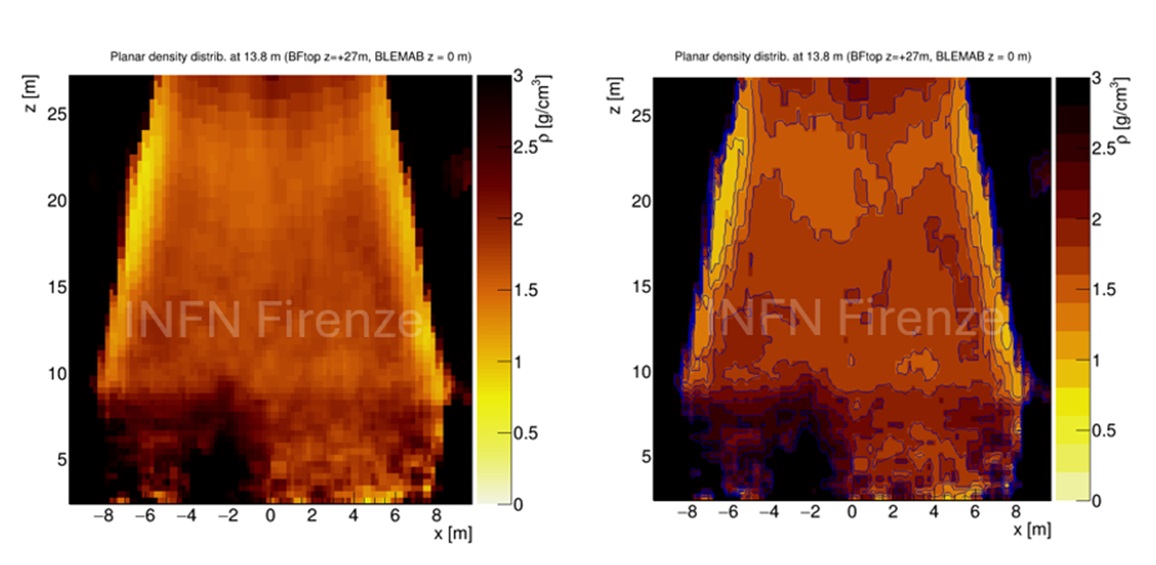
This figure shows the density distribution measured with BLEMAB 02 in RUN1 of the eMPVP probe in 56 h data taking (left) and the same plot
drawn with 0.2 g/cm3 precision contour lines, showing some stratigraphy inside BF2 (right).
As demonstrated, extending muon detection times from 14 to 56 hours substantially enhances image quality. Density variations within the blast
furnace become increasingly apparent. While a 14-hour measurement is ideal for process control, a 56-hour period offers an excellent compromise
for monitoring the slow dynamics of the blast furnace.
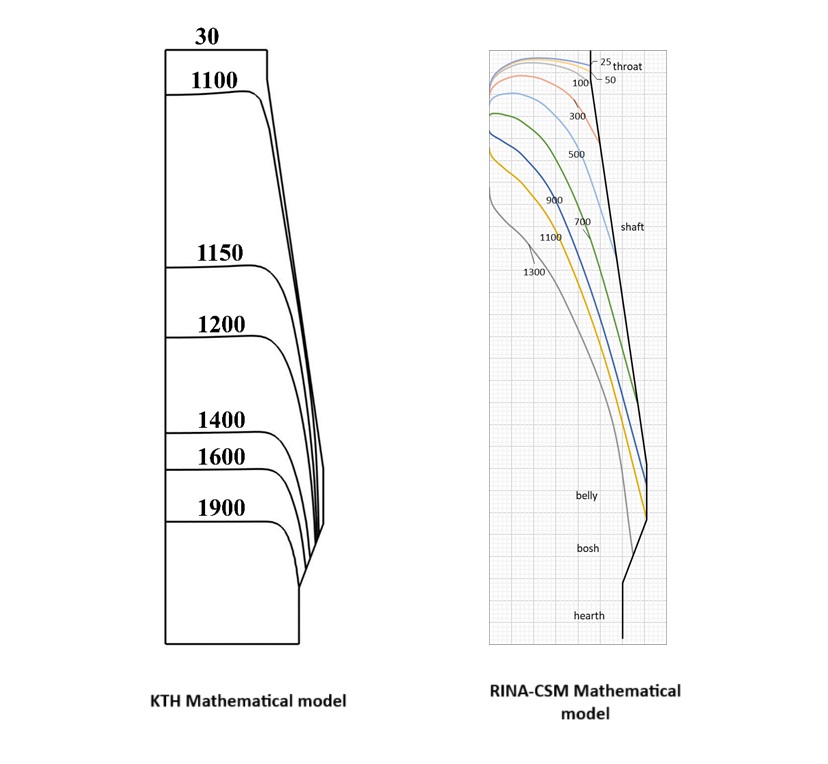
Comparison among the developed mathematical models. The two figures shows the solid phase isotherms [⁰C] computed by KTH model (left) (isotherms
calculated after tuning KTH model with eMPVP measurements using wall heat transfer coefficient) and CSM model (right).
KTH model employed an asymptotic approach to compute the solid and the gas phase velocities before modelling the heat transfer, while CSM model
assumed a constant descent speed for the solid phase in each section. This major difference in the modelling approach of these models for simulating
the flow resulted in different solid phase flow behaviours computed by both models, which also influence their isotherms. The much higher
temperatures observed for the solid phase in the KTH model compared to the CSM model are attributed to the different boundary conditions assigned
at the tuyere level of the blast furnace by these models. While the KTH model employed the typical outflow condition for the solid phase at the
tuyere flow, specifying the normal temperature gradient at the bottom boundary to be zero, the CSM model assigned an upper limit of 1300 ⁰C to
the temperature that the solid phase can have in all the zones in their model. Therefore, the maximum temperature predicted by the CSM model does
not exceed 1300 ⁰C, whereas the KTH model predicted temperatures much higher than 1300 ⁰C.
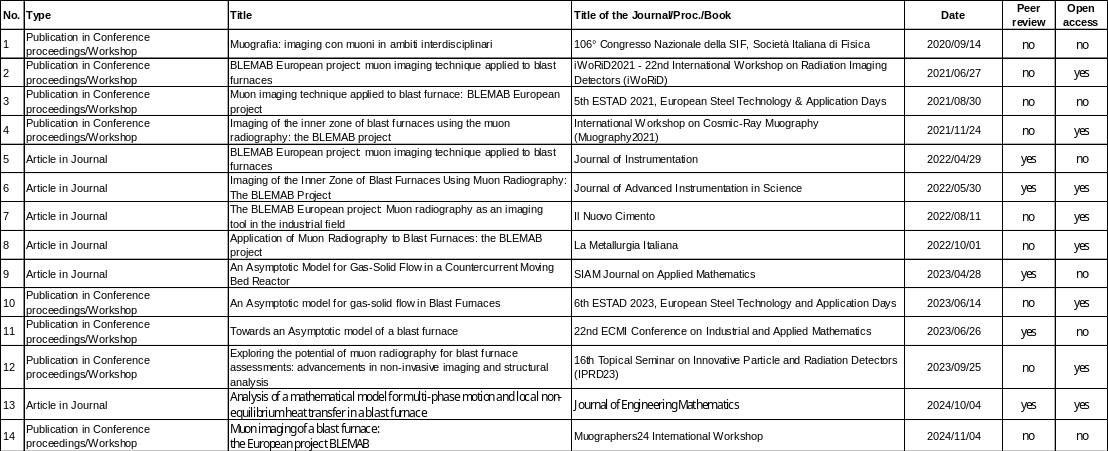
List of BLEMAB Publications